Sign up for the ControlAir newsletter.
Get news, updates, and offers direct to your inbox.
One common misconception about flow characteristic curves is that they show how much air will flow through a regulator at a given supply and output pressure. This is not the case. Flow through a regulator will depend on the unit itself, as well as several characteristics of the system it is installed in.
Flow characteristic curves instead characterize a phenomenon called “droop” in regulators. Droop is a regulator’s natural tendency to allow a drop in output pressure as flow through a unit increases. The amount of droop in a regulator will depend largely on the design of the regulator. High performing, precision regulators, such as the Type 100 typically have very little droop as flow increases.
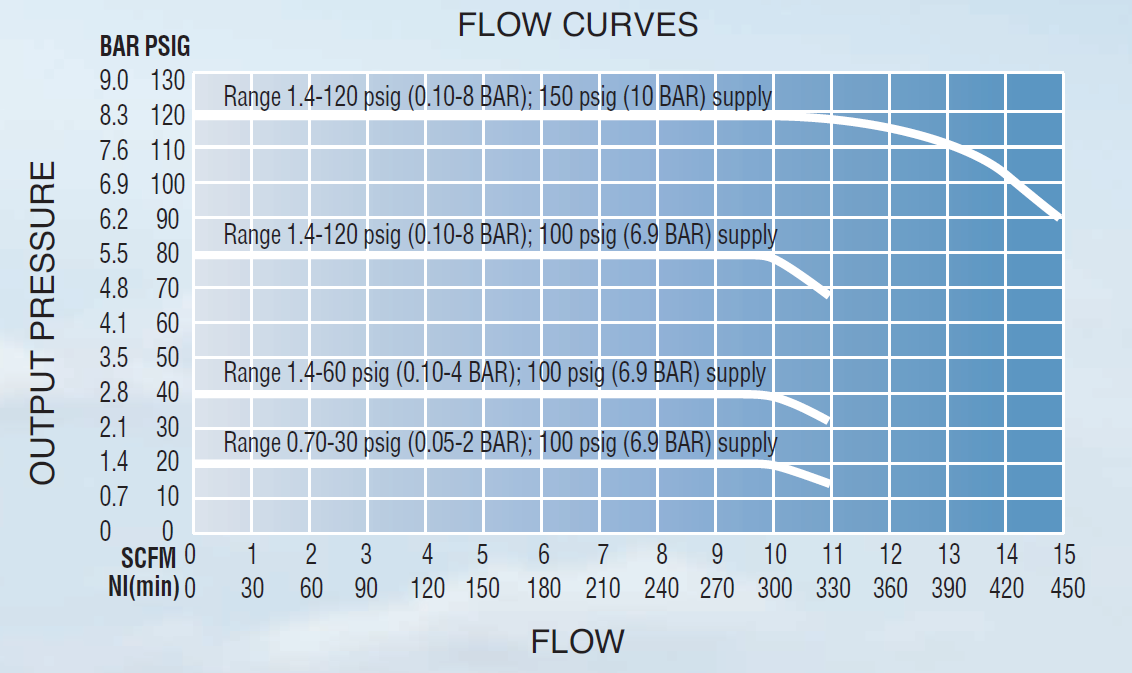
Observing the flow characteristic curve below, we see Output Pressure labeled as our Y-Axis and Flow as our X-Axis. For this example, we will be focusing on the top curve in the graph which starts at 120 PSI.

At the leftmost point of this curve, at the point at 120 PSI and 0 SCFM, we can think of this unit as in a deadheaded condition. In other words, there is no flow through the regulator. As we begin to trace the line to the right, the amount of flow through the regulator is increasing. In this particular unit, our Type 90, output pressure continues to stay very stable until about 10 SCFM of air is flowing through the unit. As the flow demand increases beyond 10 scfm, the regulator can no longer maintain its output pressure setpoint, and the output pressure will decrease. This output pressure decrease is the droop of this unit.
A graph like this can be helpful when considering which regulator to use in high flow situations. If it is critical to your process that output pressure remains at the same level, then you’ll want to select a unit that has a low amount of droop. This graph will be able to tell you how much droop you can expect at a given flow. The graphs provided are at certain input and output pressures. If your process is utilizing different set pressures, this graph will help you to extrapolate what your specific curve may look like.