Sign up for the ControlAir newsletter.
Get news, updates, and offers direct to your inbox.
Engineers who are designing or implementing a valve are aware of its Cv, or otherwise known as Flow Coefficient. This value is a coefficient used to predict flow through a particular valve based on a specific pressure drop across it. This number is a powerful tool for system engineers so they can quickly compare different valves and how it might affect the overall system. It is a simple concept when applied to standard control valves.
CV equation (for critical flow)

There are some considerations for temperature and specific gravities for the medium, but that is for a different discussion. So what are the concerns for applying a Cv to a pressure regulator?
When picking a regulator, basing the size simply on its Cv could lead to improper sizing. Cv for a regulator is normally based on its maximum flow capacity. At maximum flow capacity, the regulator is not really regulating pressure. Using a regulator at its maximum flow capacity should be the exception and not for normal operating conditions. In other words, if a regulator is in a fully open condition where the use of Cv would be appropriate, downstream pressure is never reaching the set level and the regulator could be chokepoint for the circuit. In some cases, this is momentarily deliberate, such as a purge or exhaust function, but this is not a normal operating condition.
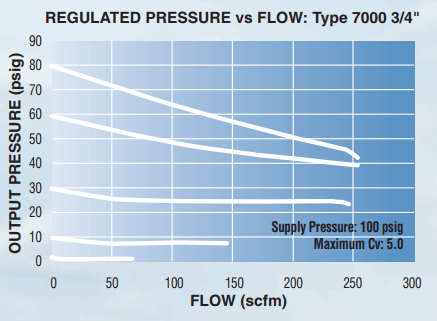
This is one reason why many pressure regulator manufacturers do not prominently display Cv values, but rather offer Flow Curves as a tool for proper valve selection. Flow curves essentially show you the amount of pressure drop across the regulator as flow increases.
Flow Curve

As an example, above is the published flow curve for our Type 7000 with a 3/4″ port. There are multiple curves based on initial set pressures but all of them have supply pressures at 100 PSI. If we take the top line as an example, the regulator is set at deadheaded condition (no flow) at 80 PSI. As flow increases the output pressure falls. If the flow is increased to 200 SCFM, the expected output pressure will be around 50 psi. One other item to note is the fall-off of pressure after 250 SCFM. Above this flow rate, the regulator is no longer regulating the output pressure.
So to sum this up, flow curves are a better design aide when selecting the appropriate regulator. Flow Coefficients should only be used as a secondary criteria during the selection process. Obviously, there are other things to consider when selecting a regulator other than flow. For help with those please contact our support desk at [email protected].